
One Chart I Never Ignore: Copper, Gold, and Global Market Dynamics
Aug 12, 2026
"The purpose of thinking ahead is not to predict the future, but to be prepared for it." Pericles
More than a decade ago, one of the traders most respected in the field said something that has never been forgotten:
"If you ever want to understand what's really happening in the global economy, stop staring at stock indices and start watching copper."
At the time, the full meaning was not immediately apparent. Copper was not exactly the most exciting market in the world, nor was it grabbing headlines like the Nasdaq or gold. Over time, however, the reasons why traders nicknamed it Dr. Copper became clear. Unlike many commodities, copper finds its way into almost every part of the economy, from housing and construction through to power grids, electric vehicles, and manufacturing. When demand for copper changes, it is often because something much bigger is happening beneath the surface.
It is one of those lessons that has stayed firmly in place ever since, and it is well worth revisiting.
CHART 1: Copper Weekly Chart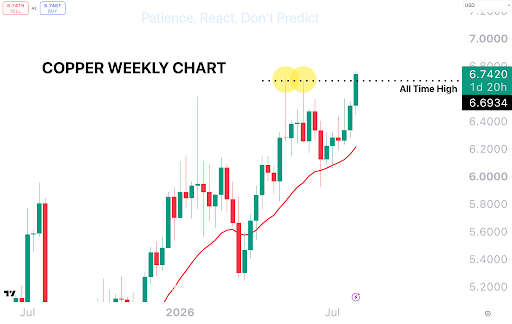
Caption: Copper could be about to close this week at a new all time high
Source: TradingView / fxevolution.com
One Chart Never Tells the Whole Story
What makes copper interesting today is that several other observations continue to provide useful context, even if they are not all pointing in the same direction.
Commentary has highlighted for some time the importance of deregulation, capital markets activity, and the return of IPOs as constructive longer-term themes for equities.
Earnings season has also produced some extraordinary moves, with both Microsoft and Amazon moving more than 15% in a single session following their results. Those reactions suggest the market is finding it increasingly difficult to reprice companies as expectations around the AI trade continue to evolve.
Fundamentally, the picture has also remained resilient. According to FactSet, 11 of the 12 major S&P 500 sectors are currently reporting year-on-year earnings growth, providing broad support beneath the surface of the market.
One area that continues to stand apart, however, is seasonality.
Historically, this time of year has often been associated with a more challenging period for equity markets, particularly as investors begin looking ahead to the later stages of the US midterm election cycle. As discussed in previous analysis, seasonal tendencies are never a forecasting tool, but they are another piece of context worth keeping in mind.
None of these observations predict what comes next.
Instead, they remind us that markets rarely move because of one indicator alone. The best decisions often come from weighing multiple pieces of evidence together, especially when some appear to be reinforcing each other while others encourage a little more caution.
CHART 2: Copper/Gold Ratio
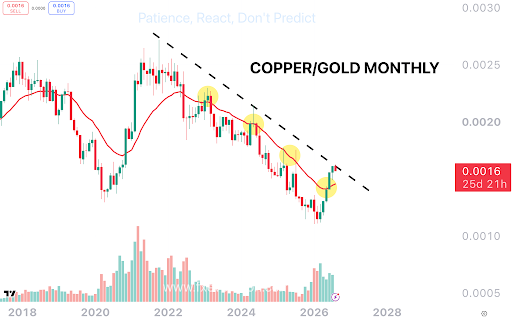
Caption: Copper/Gold has been increasing for months as yields expectations continue to also increase
Source: TradingView / fxevolution.com
What Copper and Gold Can Tell Us
The intermarket relationship monitored for years is the Copper/Gold ratio. It is not a forecasting tool, but it is one of the relationships frequently observed because of its historical connection with longer-term Treasury yields and broader macro expectations.
When copper outperforms gold, it has often coincided with periods where longer-term Treasury yields have moved higher as markets price in stronger growth and firmer inflation expectations. Conversely, when gold begins outperforming copper, it can sometimes reflect a more cautious view from the market, with investors placing greater value on defensive assets while longer-term yield expectations soften.
That is what has caught attention recently.
Copper has continued to trade strongly thanks in part to AI in 2026, but the really interesting story is that it has also started to strengthen relative to gold. At the same time, US 30-year yields have returned to levels not seen since 2007. On its own, that does not tell us where yields or equity markets are heading next. However, it is an interesting development because it suggests that demand continues to outstrip supply.
The metals market has frequently proven to be one of the more forward-looking parts of the financial system. Physical metals are influenced by infrastructure spending, manufacturing demand, and long-term supply agreements that are often negotiated well in advance. While that does not mean the metals market is always right, it does mean it is worth paying attention when these relationships begin to shift.
CHART 3: Gold Price
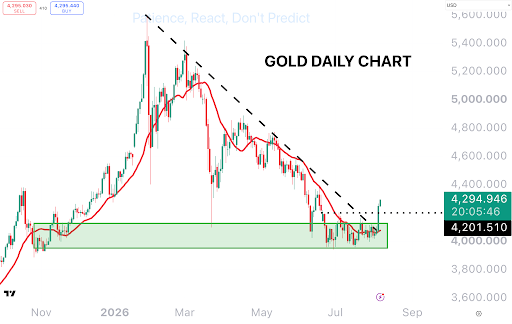
Caption: Gold price has started to potentially stabilise at a previous demand zone
Source: TradingView / fxevolution.com
A Changing Dynamic in Gold
Gold has not enjoyed the same momentum seen earlier in the year.
After the explosive rally from January and what many technicians would describe as a blow-off top, the market has spent the past few months digesting those gains, declining around 30% at its worst point. Regular observers will remember this has been discussed for several months, highlighting areas of potential demand rather than chasing prices after such an extended move.
So far, this area of potential demand continues to hold attention.
While price has cooled, the longer-term story around gold continues to evolve. According to the World Gold Council, central banks have remained consistent buyers of gold as they continue diversifying reserve assets, with China steadily increasing its official gold holdings over recent years. Beyond reserve accumulation, China is also investing in the infrastructure surrounding the precious metals market. Recent initiatives through Hong Kong to expand bullion clearing, settlement, and connectivity with the Shanghai Gold Exchange highlight the country's longer-term ambition to strengthen its role in global precious metals trading.
It is not just China.
Earlier this week, the Bank of Korea announced it will resume purchasing physical gold for the first time in 13 years, establishing a framework to buy domestically produced bullion that would otherwise be exported. The central bank stated that the initiative forms part of its medium- to long-term reserve diversification strategy while also helping reduce foreign exchange risk associated with overseas purchases.
A Final Thought
That is probably the biggest lesson taught by that experienced trader all those years ago.
Markets rarely speak through one chart.
They leave clues across many different markets, and the role of the investor is not to predict the future from a single indicator. It is to patiently observe whether multiple pieces of evidence begin telling the same story.
This week, Dr. Copper is one of those stories that will be watched closely.
Make sure to check out our featured courses.
FAQ
Why is copper often referred to as Dr. Copper in financial markets?
Copper is nicknamed Dr. Copper because its industrial demand spans almost every sector of the economy, including housing, construction, power grids, electric vehicles, and manufacturing. Consequently, changes in copper demand often serve as a leading indicator for broader economic health.
What does a rising Copper/Gold ratio typically signify?
When copper outperforms gold, it historically coincides with periods of stronger economic growth, rising industrial demand, and firmer inflation expectations, which often push longer-term Treasury yields higher.
Why are central banks continuing to buy physical gold despite recent price corrections?
Central banks, including those in China and South Korea, view gold as a key reserve asset for long-term diversification and a hedge against foreign exchange risks, independent of short-term price fluctuations.
See more articles like this.
Stay connected with news and updates!
Join our mailing list to receive the latest news and updates from our team.
Don't worry, your information will not be shared.
We hate SPAM. We will never sell your information, for any reason.
