
What Walmart, Diesel, Treasuries and Financials Are Saying About Markets
Aug 25, 2026
One of the things I've learnt over nearly two decades of following markets is that some of the most useful information often comes from places you weren't originally looking. It's easy to spend every day watching the S&P 500, Nasdaq and the handful of companies dominating the headlines, but sometimes it's diesel rather than oil, regional banks rather than the broader index, or the reaction to an earnings result rather than the result itself that gives us something interesting to think about.
That feels particularly relevant this week. Walmart has brought the US consumer back into focus, diesel continues to behave very differently from crude oil, the US Treasury has become increasingly vocal about the long end of the bond market, and financials are beginning to show some of their first more meaningful signs of slowing momentum.
Walmart and the American Consumer
Walmart's latest results were interesting because, on the surface, there was plenty to like. Revenue increased 5.9% year-on-year to roughly US$188 billion, global eCommerce sales grew 23%, and management raised its full-year sales and operating-income guidance.
Yet the shares fell sharply following the result.
Part of that reaction may simply come down to expectations. Walmart had been trading around 40 times forward earnings, a substantial valuation for a company producing mid-single-digit revenue growth. As we've discussed many times before, markets don't simply react to whether a result is good or bad; they react to the difference between what happened and what investors had already priced in.
We saw a version of this earlier in the year across hardware stocks. Some companies continued producing impressive fundamental results, yet their shares struggled because expectations had become so elevated. It's one reason I spend so much time looking through the financial press for signs of unusually bullish or bearish sentiment. I'm not looking for an automatic contrarian signal; I'm trying to understand positioning and expectations.
But Walmart also raises another question: is something gradually changing with the American consumer?
GRAPH 1: WALMART WEEKLY CHART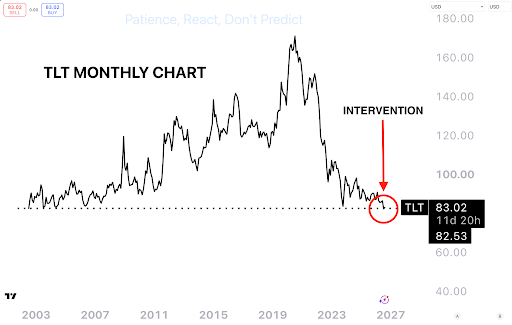 Caption: Walmart Weekly Chart Is Potentially about to close under its recent upward trendline. Source: TradingView / fxevolution.com
The Diesel Chart Most People Aren't Watching
The second observation comes from a market we've discussed several times over the past few weeks: diesel.
Most investors looking for a quick read on energy naturally pull up WTI crude oil. I've done the same thing for years. But diesel is particularly interesting because of where it sits in the real economy. Trucks, agriculture, construction, mining and freight all rely heavily on it, meaning higher diesel costs can work their way through supply chains in ways that aren't always obvious from an oil chart.
Recently, diesel futures have been behaving very differently from WTI.
The ULSD-WTI spread has moved to historically elevated levels while US retail diesel prices have risen substantially from a year ago. Oil alone therefore isn't necessarily giving us the complete picture of the energy costs being experienced across parts of the economy.
That doesn't mean higher diesel automatically produces another inflation wave. Companies can absorb costs through margins, demand can change and energy prices themselves can reverse. But when we're already asking questions about consumer behaviour and inflation, it's another piece of data worth keeping on the screen.
There's a broader market lesson here as well. Over the years, I've found that some of the more interesting opportunities to learn about a changing environment come from looking beyond whichever trade is dominating the headlines. In recent weeks some of the strongest price action has appeared in gold, silver and selected energy stocks, while much of the conversation has remained centred on technology.
Leadership can change quietly before everyone starts talking about it.
GRAPH 2: DIESEL PRICES AND WTI FUTURES
Caption: Diesel prices have historically been linked pretty closely to WTI futures, not anymore. Source: TradingView / fxevolution.com
Why I'm Watching the Treasury Response
That brings us to what may be the most important part of this week's discussion.
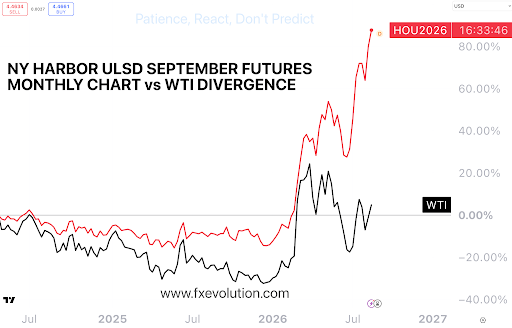
Long-term US Treasury yields have been under considerable pressure, with the 30-year yield recently moving above 5.2% and back around levels not seen since 2007. The Treasury then announced plans to at least double liquidity-support buybacks for longer-dated securities, increasing the maximum from US$2 billion to US$4 billion per operation between September and early November.
The initial reaction was noticeable, with long-term yields falling following the announcement before subsequently beginning to move higher again.
There is an interesting historical lesson here, but it's important not to take the comparison too far. 2026 is not 2007, and today's Treasury buyback program isn't the same mechanism policymakers were using during the early stages of the financial crisis.
What I find interesting is the behaviour of policymakers.
During 2007, stresses developing in credit and funding markets gradually resulted in a broader policy response as the Federal Reserve introduced and adjusted liquidity measures. With hindsight, those actions themselves became useful information because they showed us where policymakers believed pressure was becoming important.
That doesn't mean today's outcome will resemble 2007. The banking system, inflation backdrop, fiscal position and source of pressure are very different. But history has taught me that when policymakers start changing their behaviour because of what is happening in a market, it's worth understanding why.
And the story hasn't ended with the initial announcement. Over the last 24 hours Treasury Secretary Scott Bessent has again reiterated that additional tools remain available, suggesting buybacks could potentially be expanded beyond the currently announced US$4 billion level.
For me, that's the important observation. The long end of the Treasury market has become significant enough that officials are repeatedly discussing the tools available to them.
I'm not trying to predict what they'll do next. I'm interested in what their current actions are telling us.
GRAPH 3: TLT
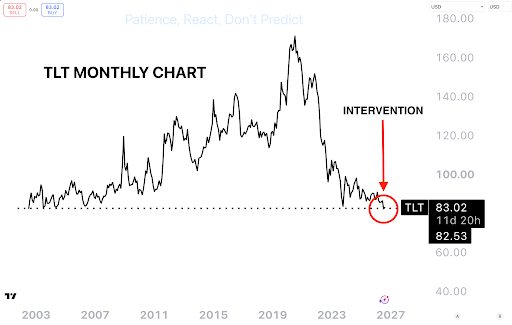
Caption: TLT levels have dropped to their lowest since 2004. Source: TradingView / fxevolution.com
Now Financials Are Joining the Conversation
This brings us to XLF and KRE.
Financials have generally held up well through much of the recent market volatility, which is one reason I've been reluctant to read too much into weakness elsewhere. More recently, however, both the Financial Select Sector SPDR and the regional-bank ETF have begun showing their first more meaningful signs of slowing momentum.
There was also an interesting flow observation this week. VolumeLeaders reported a large dark-pool transaction in XLF, ranking it as the sixth-largest XLF dark-pool transaction in its dataset.
As always, we need to be careful with what that tells us. A large dark-pool print doesn't reveal whether an institution is bullish or bearish; it could represent hedging, rebalancing, accumulation, distribution or something else entirely. What we can observe is that unusually large institutional activity has appeared at the same time the price action itself is becoming more interesting.
This is why I keep coming back to Price Action, Data and Flows. Price tells us what's actually happening, data gives us context, and flows can show us where unusually large activity is occurring.
GRAPH 4: XLF AND KRE
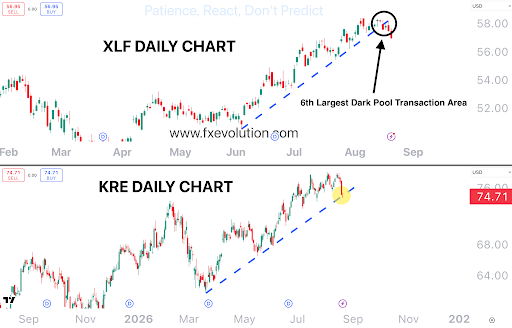
Caption: The banking sector has been very strong for most of 2026, but this week's recent developments in long dated bonds have started to slow momentum. Source: TradingView / fxevolution.com
A Final Thought
The lesson this week isn't that any one of these signals predicts what comes next. It's that some of the most useful information in markets often comes from looking beyond the obvious.
After nearly two decades of doing this, I've learnt to pay attention when different corners of the market start behaving differently. Sometimes the chart nobody is talking about is the one that makes you look at everything else differently.
Make sure to check out our featured courses.
Until next week,
Patience. React, don't predict.
Thomas Atkinson
CFTe | FXE Trading Academy
Trading financial products carries significant risk. The information provided is educational in nature and does not constitute financial advice.
References
Please verify the exact VolumeLeaders URL before publication.
See more articles like this.
Stay connected with news and updates!
Join our mailing list to receive the latest news and updates from our team.
Don't worry, your information will not be shared.
We hate SPAM. We will never sell your information, for any reason.
