
Anyone can become a trader...
BUT...
How Do You Become A Consistently Profitable Trader?
Are you tired of the trading roller coaster?
You know... one minute you make a big-profit trade... and you get that amazing feeling... like you can do anything... and you feel like you can finally be free and independently wealthy...
And then... your next trade is a loser...
And your heart sinks

If you want to finally get OFF the trading roller coaster... keep reading!
And then... you buy more, at the lower price... and you justify it by saying you’re “lowering your cost basis”...
BUT THEN... THE PRICE GOES DOWN EVEN LOWER.
And now you feel terrible... and hopeless... and you feel like you don’t even know what you’re doing... you feel like giving up... like maybe this trading thing isn’t for you... and maybe there really isn’t any way to make consistent money in the markets...
But then you make another trade... that wins!
And then another that loses.
And on and on and on the roller coaster goes... up and down and up and down and up and down...
And none of it makes any sense...
And you can’t figure out how all these people on Youtube are making so much money at trading...
Because, to you, it just seems like a never-ending roller coaster... and on balance, at the end of most days, weeks, and months, you’re losing money.
How to get OFF the trading roller coaster... and finally start making consistent profits
When we first started trading, we were like you — we were on the trading roller coaster... and we couldn’t get off.
We were losing money, and we had no idea why.
We couldn’t find a system or method that actually worked to CONSISTENTLY make us money in the markets.
So, we set out to do just that. We ended up spending years studying the best traders in the world, and studying the markets, and learning technical analysis...

And we FINALLY found something that helped us to become consistently profitable at trading.
And, in theory, it’s actually really simple.
It all boils down to just two things:
1. You have to see what’s really happening in the markets
2. You have to do more than what most traders do
After we started doing those 2 things... we've been able to...
✓ Develop a disciplined, rules-based approach to trading
✓ Build skills to identify and
manage high-probability trade setups
✓ Pursue greater financial literacy and independence
— on your own terms
✔ Learn to identify trade setups targeting favourable reward-to-risk ratios, with a focus on disciplined risk management
✔ Apply the same structured methodology across different account sizes, with appropriate
risk parameters
✔ Trained more than 6,500 traders in our methodology — individual results vary significantly based on experience, discipline, and market conditions
So, what ARE those 2 things that helped us
become consistently profitable in our trading?
We’ll explain them here, in the next 2 sections...
(1) You have to see what’s REALLY happening in the markets
When we first started trading, we were blind.
We weren’t seeing what was actually happening in the markets.
We were being manipulated every day, by the large trading institutions, and we didn’t even realize it.
This is what happens to almost every individual trader.
And until and unless you see this, and understand it, you won’t be able to make consistent profits in the markets.

Everything changed for us when we found Richard Wyckoff
Wyckoff proposed that individual traders (like us) should imagine that the market was being (mostly) controlled by a single entity. And once you understand how this single entity (the “Composite Man”) thinks and behaves, you can find lucrative entry and exit points for trades that will result in consistent profits, over the long-term.
Here’s how it works:
This single entity, or “Composite Man” that Wyckoff proposed, is all of the big Wall Street investment institutions and brokers, combined together. We need to think of them as one single entity that is controlling the market (more or less). This group of Wall Street institutions (the “Composite Man”) have millions (and sometimes billions) of dollars of trades that they MUST execute every single day and every single week.
But it’s not easy to for them to execute that many orders, because they need enormous liquidity to do it.
So, to create that liquidity for themselves, these institutions HAVE TO manipulate individual traders in order to alter the supply and demand of the market, so they can execute all these orders, at the prices they want to buy and sell at.
So they use psychological tactics and algorithms to create the supply and demand they need, so they can buy and sell their huge number of orders every day and every week.
But because of the constraints of how the markets work, there are only a few ways that the “Composite Man” (all the Wall Street trading institutions) can achieve this liquidity effectively.
And so, the “Composite Man” repeats these few, effective patterns over and over and over again, every day and every week in the markets.

Now, you may be thinking, “Ah, if I can just spot these patterns, then I can set up some great trades.” And that’s partially true, but... the trading patterns of the “Composite Man” are not as easy to spot as the patterns that most trading gurus teach, mostly because these aren’t just patterns. It’s too involved to describe fully here, but you need to learn to spot the pieces of the “patterns” and schematics that the “Composite Man” uses, and then you build confidence and confluence for your trades when you spot the other pieces occurring.
But once you learn how to spot these pieces and schematics, you can now place trades that ride on movements in the market that are MUCH MORE PREDICTABLE.
They’re more predictable because the “Composite Man” HAS TO trade in these patterns... first, because they have all these orders that they HAVE TO fill (it’s their job), and second, because there are only a handful of ways they can actually trade to create this enormous amount of liquidity that they need to fulfill their orders.
So, learning how the “Composite Man” thinks and behaves in the markets is a HUGE step toward profitable trading, on a consistent basis.
But... that didn’t get us all the way to consistently profitable trading...
We still had to learn #2, which is...
(2) You have to DO MORE
than what most traders do
When we first started trading, we didn’t do much before we pulled the trigger on our trades.
We might have looked at a few indicators, or checked to see if there was any news that could affect our trade... but we didn’t do much more than that.
But then, we found Stanley Druckenmiller...

...and we learned his top-down approach, which takes into consideration macroeconomic factors that could affect our trades, like federal funds rate, unemployment rates, global and country-specific gross domestic product, inflation rates, etc.
Most traders don’t realize it, but markets and instruments are all intrinsically linked, and movements in one, can definitely affect the others... and so this is why we use these macroeconomic factors in our determination of whether a trade is viable or not. In our minds, to not use them, would be irresponsible and ignorant.

And, we learned technical analysis, and how to build confluence and confidence in our trades...
This was a game changer for us, because we started using a number of technical analysis tools and indicators, like Fundamental metrics, Fibonacci Numbers, Candlestick Analysis, Supply/Demand, and more.
And we started using Multi-Timeframe Analysis to further build the case for the viability of our trades.
And then, we also learned...
...how to use all of the traditional risk management tools and methods...
...and how to strive for a disciplined, smart, mature psychological basis from which to make our trading decisions.
BUT... it was doing ALL of those things, that made
such a big difference in our trading results...
And when we combined all of that with
Wyckoff’s “Composite Man” (that we discussed above)...
We started getting results that were almost unbelievable!
But, WHY does our method work better than anything else we’ve ever tried?
There are 3 reasons our method for day trading and scalping works better than anything else we’ve ever found:
- More Predictable
- More Movement
- More Risk Management
Let’s look at each of these in more detail:
(1) More Predictable
Most traders are taught to find the patterns and follow the momentum or trends that other retail traders create when they trade in the market, or they rely on one or a few indicators to determine direction, entry points, and exits. While these factors can be useful in other types of trading, they are actually HIGHLY UNPREDICTABLE and UNRELIABLE when it comes to day trading and scalping. This is because other individual traders are human beings and human beings are, by nature, unpredictable. As an example, some traders will react to a downtrend by buying, some will hold, and some will sell. It is impossible to predict what all of them will do, and so using this as a basis for determining direction, and your entry and exit points, is a very UNPREDICTABLE and UNRELIABLE method... even though this is exactly what many, many traders do every single day!
Our method follows and executes alongside a different entity — the “Composite Man,” which, as we discussed in the section above, is the aggregate of all of the largest investment institutions on Wall Street. This group thinks and behaves in a MUCH MORE PREDICTABLE manner, because they HAVE TO. They have millions or even billions of dollars of orders that they MUST place every day and every week, and so they use tactics and algorithms to help them get enormous amounts of liquidity in the markets, that help them place and sell their orders at the prices they need. Since they HAVE TO do this (because it’s their job), and since there are only a few effective ways to actually do this, the “Composite Man’s” patterns of behavior are much More Predictable than anything else in the market. And as we’ll see in number 2 below, because the “Composite Man” is large enough to move the markets substantially, this creates opportunities for individual traders (like you and us) to get in and ride the wave on market and instrument movements that can be extremely lucrative.
(2) More Movement
As we’ve discussed, most day traders and scalpers are relying on patterns or momentum and trends that are comprised mostly of other retail, individual traders. The problem with this is that, even in very large groups, retail and individual traders cannot move the market. This is primarily because they don’t have enough FORCE, because their numbers are just too small — they don’t represent enough orders... and secondarily, because these traders don’t all move together as a single entity, so their direction is almost always shifting back and forth, not unified in one direction.
The “Composite Man,” on the other hand, acts much more like a single entity, moving in the same direction much more of the time, and the “Composite Man,” because it is the aggregate of all the biggest Wall Street investment firms and brokers, has numbers that are definitely large enough to move the market SUBSTANTIALLY. Another way of saying this is: the “Composite Man” has plenty of FORCE to move the markets substantially.
It’s this SUBSTANTIAL MOVEMENT of the market that enables us to consistently make trades that yield 4:1 to 10:1 (and even 20:1 sometimes) Reward to Risk. You simply cannot make trades that yield that much spread without a SUBSTANTIAL movement in the market.
So, this is how our method of following and executing with the “Composite Man” gives us More Movement, which helps us execute trades that have much higher payouts.
(3) More Risk Management
Most day traders and scalpers rely only on a few factors, indicators and the traditional methods of risk management. That’s not good enough for us.
In addition to following and executing alongside the “Composite Man,” we also apply a top-down approach that considers macroeconomic factors that could affect our trade, like federal funds rate, unemployment rates, global and country-specific gross domestic product, inflation rates, etc.
And then, we also apply a number of technical analysis tools and indicators to every trade we’re considering, like Indicators, Fibonacci Numbers, Candlestick Analysis, Supply/Demand, and more. Then, we use Multi-Timeframe Analysis to further build the case for our trade’s viability. And finally, on top of all that, we also use all of the traditional risk management tools and methods... AND strive for a disciplined, smart, mature psychological basis from which to make our trading decisions.
As you can see, we do a lot more diligence and research on each of our trades than most traders, but... can you see how this approach would not only yield many more highly-profitable trades, but also protect your capital better than just using the traditional risk management methods alone?
(It’s also worth mentioning that once you learn how to do all the diligence that we do, you can start to get a lot faster at doing it, and even automate parts of it, so you don’t end up becoming a slave to your charts, and you don’t have to sit in front of the computer all day long.)
Can you see how this approach gives us much More Risk Management than other day trading and scalping methods do?
So... how can YOU learn this too?
And start making more consistent profits in YOUR trading?
Right here, on this web page, we don’t have enough room (or time) to teach you our entire method.
We used to teach it one-to-one with our students... with great success.
But soon after we started, we found there were far too many students who wanted to learn it, and it became cumbersome to teach it one at a time.
So, we created a course that we call the Technical Analysis Masterclass.
This comprehensive course was created to teach you our entire method, as described above, so you can learn how to become a consistently profitable trader.
The course is broken up into 6 different modules...
And here’s just a small sample of what
you’re going to learn in each of the 6 modules:
MODULE 1: PRICE & TREND ANALYSIS
In this module, you’ll learn why price action is the most important leading indicator available to help identify the next market move.
You’ll also learn:
- How to interpret and use the different types of charts that you’ll find on most trading platforms

- There are hundreds of different candles... we’ll show you the most common and useful ones — those can actually help you identify the next potential direction of the market
- The differences, advantages, and disadvantages of using line charts, bar charts, and candle charts
- Want to know when a downtrend is going to end? The all-important Hammer Candle can help you here... We’ll show you how they work, we’ll break down all of their stages, and we’ll show you how to use them to find great buy-in points
- The basics of Range Candles, how to determine if a candle is short-range or long-range, and how candles give you information about what price has done recently
- Why you should pay close attention when a Hammer Candle forms after a series of bearish candles...
- With ALL candles... the longer the timeframe, the more important the candle’s signal... you’ll learn why this is in the Candles & Bars Video
- How to make big profits trading... WITHOUT having to worry about getting your entry points perfect... and WITHOUT having to worry about hitting perfectly precise take profit targets
- How to spot a short-term uptrend and a short-term downtrend
- How to tell the difference between a CHANGE and a long-term TREND
- What Inside Bars are, what they indicate, and how to spot them
- How to know when price activity is just noise... and when it is actually a leading indicator of changes in price trend
- Why identifying short-term trends is easy... and HOW to do it, step-by-step
- Why it’s important to see when a trend has changed direction... and how to do it
- How to spot long-term uptrends and long-term downtrends... what they mean... and how you can use them in your trading
- Why performing Multi-Timeframe Analysis is so important... BEFORE you make any trading decisions
- What Buyer & Seller Dynamics are, why they’re important, and how to use them in your trading
- How to do Multi-Timeframe Chart Analysis, and how it can give you valuable insight into where price may be heading
- HOW and WHEN candlestick patterns can give you quality entry and exit points, and confirm key reversal zones
- In the Candlesticks Patterns Video, you will learn some of the most popular candlestick patterns used by traders, including the Engulfing Patterns, Star Patterns, and Harami patterns
- What the Engulfing Pattern is, when it forms, what it indicates, and how it can help you make profitable trades!
- Why it’s much more LUCRATIVE & PROFITABLE to trade on candlestick patterns that have other supporting evidence such as support and resistance, or as part of a larger chart pattern...
- What the Morning Star and Evening Star patterns are, and how you can benefit from them
- The REALLY IMPORTANT reason we focus on only a handful of candlestick patterns... even though there are hundreds of them
- And there’s lots more!
MODULE 2: CHARTING TECHNIQUES
In this module, you’ll learn the charting techniques and tools that can be used in any type of market and trading condition.
You’ll also learn:
- The importance of Support and Resistance, how they work together, and why they can be a “cornerstone” of any profitable trading strategy

- How to identify and trade Horizontal Support and Resistance lines -- including where to consider taking profits
- How to look for confirmation of Support and Resistance lines, so you can feel confident in their validity
- Why not all Support and Resistance lines are equal, and how to spot additional factors that can strengthen or weaken these areas
- What it means when Support and Resistance are close together, and what to do when you notice this pattern
- How to ensure you’re using Support and Resistance on the proper timeframes
- Role Reversal Zones: what they mean, why they’re so important (in some ways even more important than standard Support and Resistance areas), and how to avoid the common trap of not properly utilizing them to their full potential!
- How to identify Role Reversal Zones (the rules for identifying these zones differ from “normal” Support and Resistance, so it’s important to know the difference)
- Familiarizing yourself with both Uptrend and Downtrend Role Reversals
- How to use Trend Lines to discover and trade in the direction an instrument is currently trending in, so you’re trading on the right side of the move
- Key differences between Trend Lines and standard Support and Resistance, and how to adjust your strategy accordingly
- Rules for identifying and validating Trend Lines, both in upward trends as well as downward trends (Trend Lines can be highly subjective, so knowing and FOLLOWING these rules is critical!)
- Where to place Stop Losses when taking trades based off Trend Lines
- How to identify key areas where Trend Lines may weaken or falter
- Why “overthinking” or looking for “perfect” Trend Lines is not advised, and what to do instead
- The importance of Channels, and why they are so prized among short- and medium-term traders (hint: once established, these can be very reliable and provide easy trading opportunities for quite some time)
- The 3 types of Channels that form in the market, and how to pinpoint and validate them
- Where to place Profit Targets and Stop Losses when trading Channels
- A common mistake many traders make when taking positions based on Channels, and how to avoid it (note: this applies whether you’re taking a long OR short position!)
- The significance of a Channel Breakout, i.e. the “end” of a Channel -- and a systematic process for trading it
- What Fibonacci Numbers and the “Golden Ratio” are, and why they’ve been scientifically significant for hundreds of years across many disciplines -- including Technical Analysis!
- Fibonacci Retracements: why we consider them to be the most reliable Fibonacci tool, and how to use them to reliably help you determine Support and Resistance, as well as entries, exits, stop losses, and profit targets!
- Determining the most optimal Fibonacci Retracement Zones (including when to DISREGARD certain Fibonacci levels, and why)
- Rules for interpreting and trading Fibonacci Retracements in an uptrend OR downtrend
- Why Fibonacci Retracements should not be used “in a vacuum” -- and how to use them in conjunction with other trading techniques for best results
- Lots of real, visual examples!
- And more!
MODULE 3: CHART PATTERN ANALYSIS
In this module, you’ll learn how to not only identify the quality patterns as they form, but also how to trade them accurately from stop loss to take-profit level.
You’ll also learn:
- Why Double Top and Double Bottom patterns generally work, and how to trade them

- Why Double Top and Double Bottom patterns are VERY RARELY traded correctly -- and how to avoid the all too common mistakes traders make when attempting to trade them!
- Simple rules that will minimize uncertainty and make Double Tops and Double Bottoms easy to identify AND trade
- How to choose only quality Double Top and Double Bottom patterns, increasing your chances of success with them
- The often overlooked factors that MUST be present in order for a Double Top or Double Bottom pattern to be valid
- What a “Neckline” is, and how to easily identify it and use it to determine when to take a trade on a Double Top or Double Bottom pattern
- The thing GOOD traders need to see BEFORE executing a Double Top or Double Bottom trade (don’t jump the gun, or you’ll be one of the many who fail to properly capitalize on this pattern!)
- What the most reliable Double Tops and Double Bottoms have in common, and how to spot it
- How to EASILY calculate Profit Targets and Stop losses when trading Double Tops and Double Bottoms
- A simple rule for ensuring you maintain a good RISK-REWARD RATIO on Double Top and Double Bottom trades
- Why trying to predict Double Top or Double Bottom price action can be very dangerous -- and what to do instead!
- An “intuitive” method that can help you discover if a Double Top or Double Bottom isn’t worth trading
- Why Head and Shoulders patterns form in relation to the market action, what each part of the pattern represents, and how to identify and trade them correctly
- What should happen BEFORE you trade a Head and Shoulders pattern
- A simple yet powerful “rule of thumb” for identifying only high quality Head and Shoulders patterns (this is very important as Head and Shoulders patterns can be notoriously subjective)
- When and how to trade “imperfect” Head and Shoulders patterns, i.e. alternative variations of this pattern that can be every bit as powerful as the “textbook” version!
- Where to set Stop Losses and Profit Targets when trading Head and Shoulder patterns
- Why many Head and Shoulders patterns DON’T end up in a BIG reversal, and how you can successfully trade them for profit anyway!
- How to identify and trade Inverse Head and Shoulders patterns (including “imperfect” variations on this pattern)
- Correctly identifying Triangle patterns (symmetrical, ascending, and descending), and how to trade them -- both long and short -- using the most effective Stop Loss and Take Profit levels
- Why Flag patterns have a great success rate, IF you trade them correctly, using the methods you’ll learn here
- The little-known culprit that causes many traders frustration as their Flag patterns don’t resolve the way they’d predicted (hint: it’s not because they misread the Flag… But rather because another key “ingredient” was missing)
- A simple, VISUAL way to VALIDATE a Flag or Pennant pattern
- How to correctly trade Pennant patterns
- How to visually separate the best Triangle, Flag, and Pennant patterns from the lower quality setups
- Lots of real, visual examples!
- Plus more!
MODULE 4: TRADING INDICATORS
Confused with the hundreds of different indicators out there? In this module, we’ll show you the best ones, and how to use them to maximize your opportunities in the market.
You’ll also learn:
- The importance of Moving Averages, including their history… Plus, why so many traders rely on them, how they’re calculated (if you’re not good at math, don’t worry, your trading platform will do this for you!) and more

- Understanding the different types of Moving Averages, and how to choose the right ones for YOU
- Using Moving Averages to help identify current trend direction, trend change, and dynamic Support and Resistance
- The powerful MACD indicator: what it represents, how it forms, and how to interpret it (plus, why it’s one of the rare indicators that works in “directionless” markets as well as trending markets)
- Properly trading MACD “crossovers” and divergence, both long and short (including when to place your orders)
- How to use and interpret the Stochastic Oscillator, as well as how to identify the market conditions that this popular indicator works best in -- this is important because many traders interpret its signals INCORRECTLY, or use it in the WRONG type of market!
- Using the Simple Stochastic, Stochastic Crossover, and Stochastic Trending trading methods (plus, how to interpret and trade Stochastic divergence)
- Key adjustments when using the Stochastic Oscillator to trade in an UPTREND or downtrend -- including one thing you should NEVER attempt when doing this!
- How to use RSI (Relative Strength Index indicator) to establish a trend bias on a particular stock
- How to use “overbought” and “oversold” levels to trade in the direction of the trend with RSI
- Going beyond “overbought” and “oversold”: how to use RSI in varying market conditions
- Identifying and trading RSI failure swings (these are strong indicators of possible reversals, and are often reliable when they form!)
- Simple yet effective rules for trading RSI divergence
- Simple, powerful rules for trading with the Bollinger Bands indicator -- including when to get in and when to take profits
- Understanding how Bollinger Bands interact with price action
- The Bollinger Band “mistake” that can cause you to end up with too many false signals, and how to avoid it!
- How to interpret the different Bollinger Band deviations
- Trading the Bollinger Bands during extreme moves
- Trading with Bollinger Bands in sideways markets with low to medium volatility
- How to interpret -- and trade -- Bollinger Band divergence
- Lots of real, visual examples
- …And plenty more!
MODULE 5: ADVANCED TECHNIQUES
In this module, you’ll learn the advanced trading concepts that can be applied to trending and range-bound markets, that we use every day in our trading.
You’ll also learn:
- Why reversal chart patterns like Double Tops and Double Bottoms can also act as great signals for trend continuation -- and how to properly use them to do it

- How to use Double Top chart patterns to pinpoint good re-entry points to join an existing downtrend (and how to use Double Bottom patterns to join an uptrend)
- Standard AND conservative entries for using Double Tops and Double Bottoms to join a trend, plus the pros and cons of each
- When and how to trade Potential Double Top and Double Bottom patterns -- this is a more aggressive entry method that involves predicting the pattern before it’s finished forming -- yet can come with a solid success rate if executed properly!
- Why it’s important for traders to look for MORE evidence to confirm the quality of re-entry points AFTER identifying them -- and how to do it
- How to overlay Fibonacci levels and Trend Lines to significantly enhance the reliability of your re-entry zone and confirm patterns in existing trends (you can use these individually, or combine them together for even greater reliability)
- How to use the MACD indicator to strengthen the validity of patterns
- Using Bollinger Bands to assess the reliability of patterns (including what settings work best for this purpose)
- Combining various indicators as supporting evidence to “make a case” for or against taking a particular trade
- How to verify the strength of the existing trend you are about to join -- on the correct time frames
- Our proprietary ELD 3-6-3 Multi-timeframe System that takes the guesswork out of determining the best time frames to use
- A straightforward process for applying the ELD 3-6-3 Multi-timeframe System to your trading plan
- Using the ELD 3-6-3 to trade in existing uptrends and downtrends
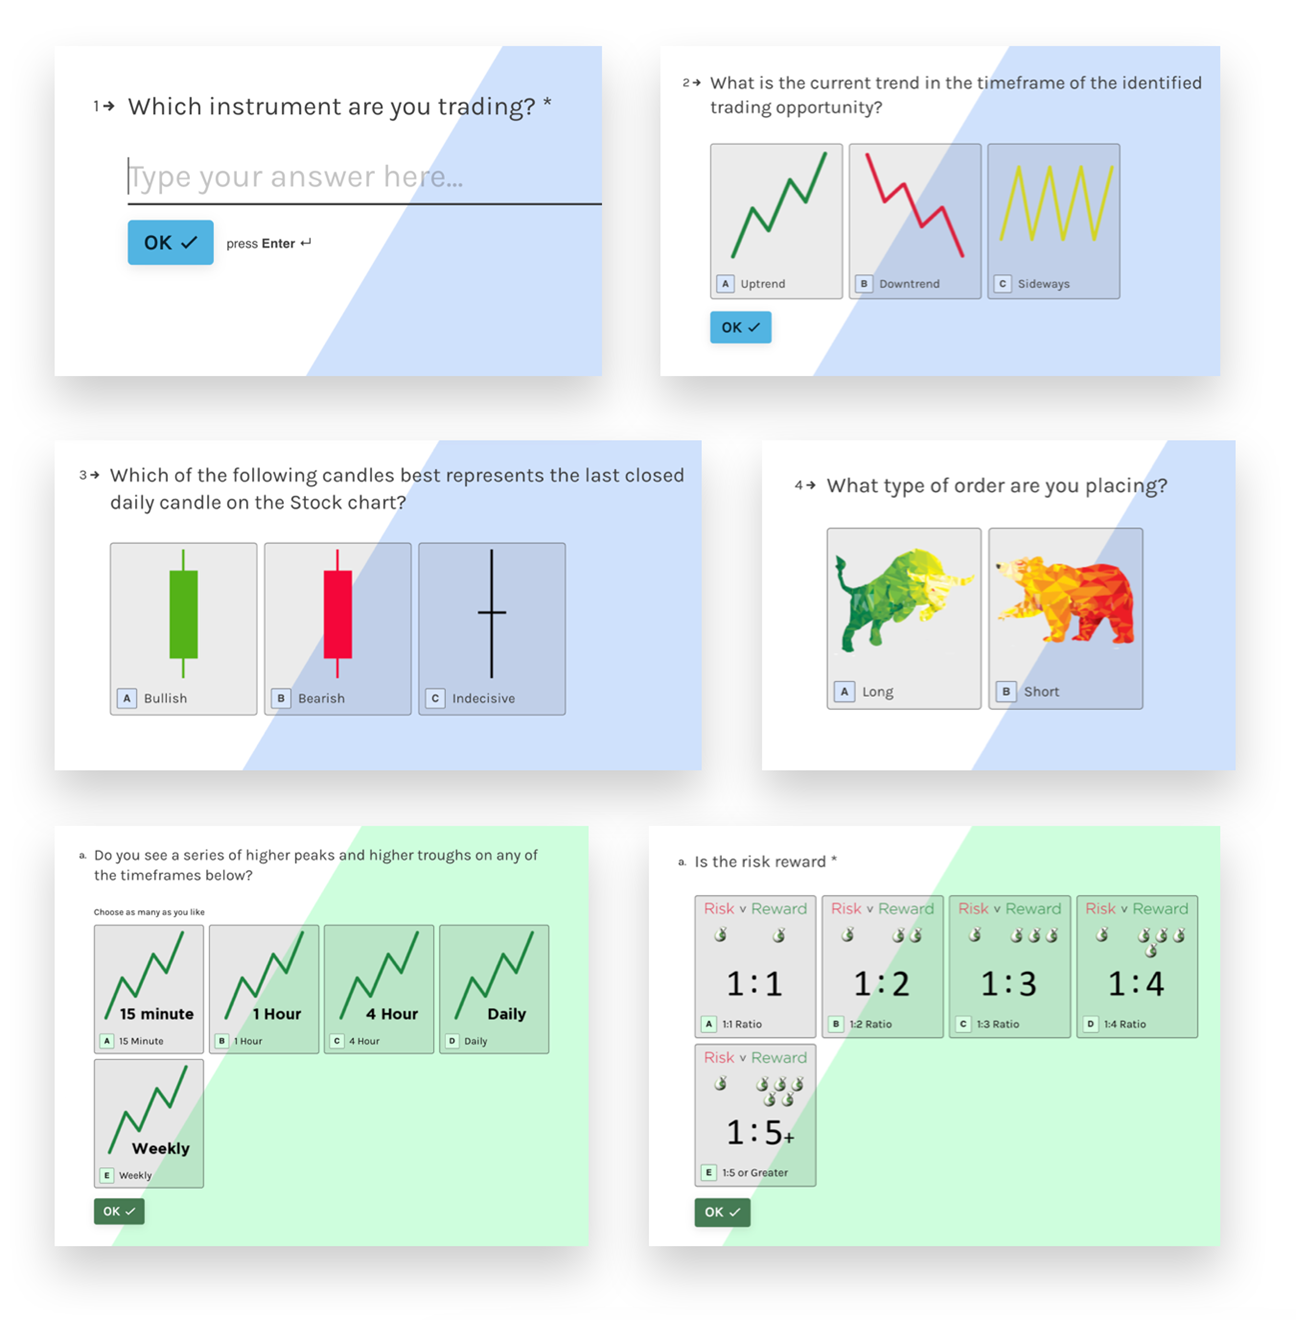
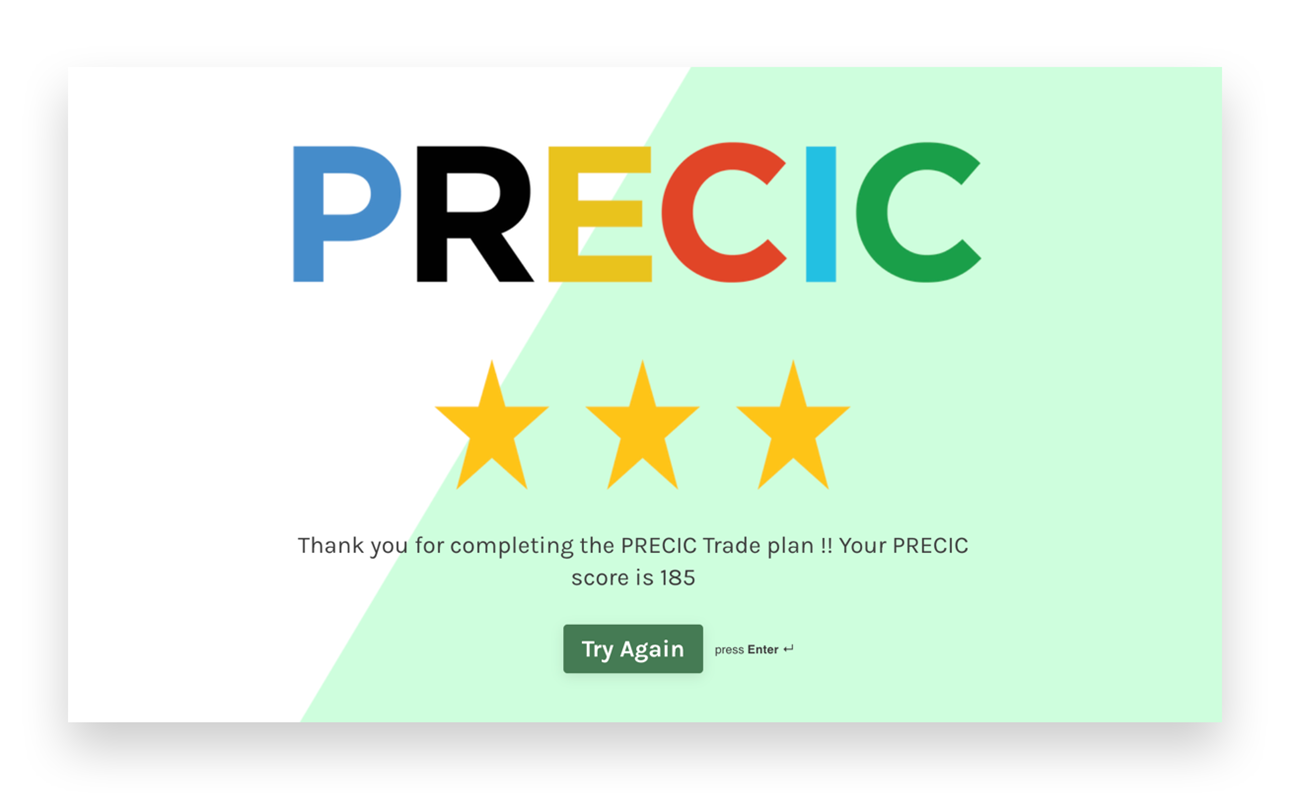
- The PRECIC Points Based Trading System -- our proprietary “blueprint” that will help you quantify the quality of trades, and ensure that a layer of consistency is applied to the analysis techniques you’ve learned in this course
- A thorough walkthrough to understanding each of the components that make up the PRECIC system, and how to use them
- Detailed instructions for rating each score within the PRECIC system
- How the elements of the PRECIC trading system work together for maximum effectiveness
- The benefits of trading in a range-bound market
- Identifying range-bound markets to trade using Channels and Triangles (plus, key indicators that can also help with this)
- The best timeframes to use when trading in range-bound markets
- Chart patterns to use at the top -- or bottom -- of a range-bound market
- Trading in the MIDDLE of a range-bound market (including which chart patterns are most effective in this environment)
- Two key rules you must follow when attempting to trade a reversal chart pattern inside a large consolidation zone
- How to trade Double Top or Double Bottom chart patterns in the middle of a range
- Scalping Potential Double Top and Bottom patterns inside a range
- MANY real, visual examples!
- And much much more...
MODULE 6: TRADE MANAGEMENT
In this module, you’ll learn how to manage risk, as well as how to apply the correct psychological approach to your trading plans.
You’ll also learn:
- Why you shouldn’t always just place a buy order after you’ve done your market analysis and decided what to trade… And what you should do first!

- Understanding the 6 order types available to traders, and how to determine which types best fit the trades you’ll be entering (hint: they all have different characteristics, suited to particular market conditions)
- How to place trades using Market, Limit, Stop Orders, and more
- The importance of Stop Loss and Take Profit zones (in many ways, these can be THE defining factor in how successful your strategy ultimately fares)
- The “Golden Rules” of Stop Loss and Take Profit zones
- The different ways Stop Loss and Take Profit zones can be calculated, and how to do it
- The detrimental mistake many traders make when it comes to SELLING (both their winners AND their losers), and two simple rules for correcting it
- Where to place Stop Loss and Take Profit zones for Channels, Double Tops, Double Bottoms, Triangles, Flags, Pennants, and more
- Why “taking profits early” isn’t always good advice, and how to adjust your thinking to be more in line with excellent trade management methods
- How to use Dynamic Stop Loss levels in trends
- How to choose the correct position size for your trade -- this is one of the decisions that ultimately separates professional traders from the rest!
- The massive mistake many traders make when it comes to position sizing, and what you should do instead… This is directly related to risk management and should never be ignored!!
- The mechanics of leverage, how it works, and how to understand it and use it to your advantage (while protecting yourself from its dangerous pitfalls!)
- The math of trading with leverage vs trading with a strictly cash account
- Common leverage mistakes, and how to avoid them
- Why failing to integrate the correct psychology into your trading plans can cause you to fail, even if you “do everything else right”... (Many refuse to believe this, and they’re usually the ones that don’t make it!)
- The 4 key psychological characteristics all successful traders possess
- The emotions that you can expect to encounter while trading -- being prepared for these will help you deal with them better when they inevitably arise!
- How to properly manage the individual risk of each trade… to protect your capital, your account, and your sanity!
- The importance of good risk-to-reward ratios (hint: you want to minimize downside, while maximizing your UPSIDE)
- How to maintain discipline while trading, so you’re always in control -- including specific behaviors to avoid when placing trades
- Why having a trading system with excellent signals is STILL not enough to ensure your long-term success as a trader… and what you must “layer on” in order to make it
- How to employ excellent risk management methods to stack the odds in your favor -- literally and figuratively!
- Why much of your trading success depends on your PSYCHOLOGY… And how to employ the right psychological approach to set you up for sustained success
- …plus a lot more!


Technical Analysis MasterClass
Frequently Asked Questions
When does this course start and finish?
How long do I have access to the course?
What if I have questions about a topic or something isn’t clear, who do I ask?
Do I need to register with a trading platform?
I have some other questions that aren’t mentioned here. Whom do I ask?
Trading Disclaimer:
FXE Trading Academy Pty Ltd, Corporate Authorised Representative of Allied Financial Solutions Pty Ltd, AFSL 230172
Trading derivatives carries a high level of risk to your capital and should only be traded with money you can afford to lose. CFD's are complex instruments and come with a high risk of losing money rapidly due to leverage.
Trading financial products carries significant risk. The information provided is educational in nature and does not constitute financial advice. Past performance is not indicative of future results. Please consider your own circumstances before making any trading decisions
Ensure you read our FSG and Terms & Conditions, and seek independent advice, to fully understand the risks, before deciding to enter into any transactions with FX Evolution. The general information on this website is not directed at residents in any country or jurisdiction where such distribution or use would contravene local law or regulation.
